KFtray is a application that can be integrated into the system tray for easy interaction with kubectl port-forward commands. A additional feature has joined recently in new version 0.11.7, one that can make HTTP traffic traces logs; this is an new method that simplifies debugging. This article provides a short guide on how to get started with the new feature.
New in v0.11.7
- Toggle HTTP Logs: Easily enable/disable HTTP logs for configurations, saved in
$HOME/.kftray/http_logs/{config_id}_{local_port}. - Clean Logs Folder: New button to tidy up the logs folder.
- Logging Controls: Buttons to turn HTTP logging on or off for each configuration.
- Open Logs with Default Editor: Icon button to open HTTP logs with your default OS text editor.
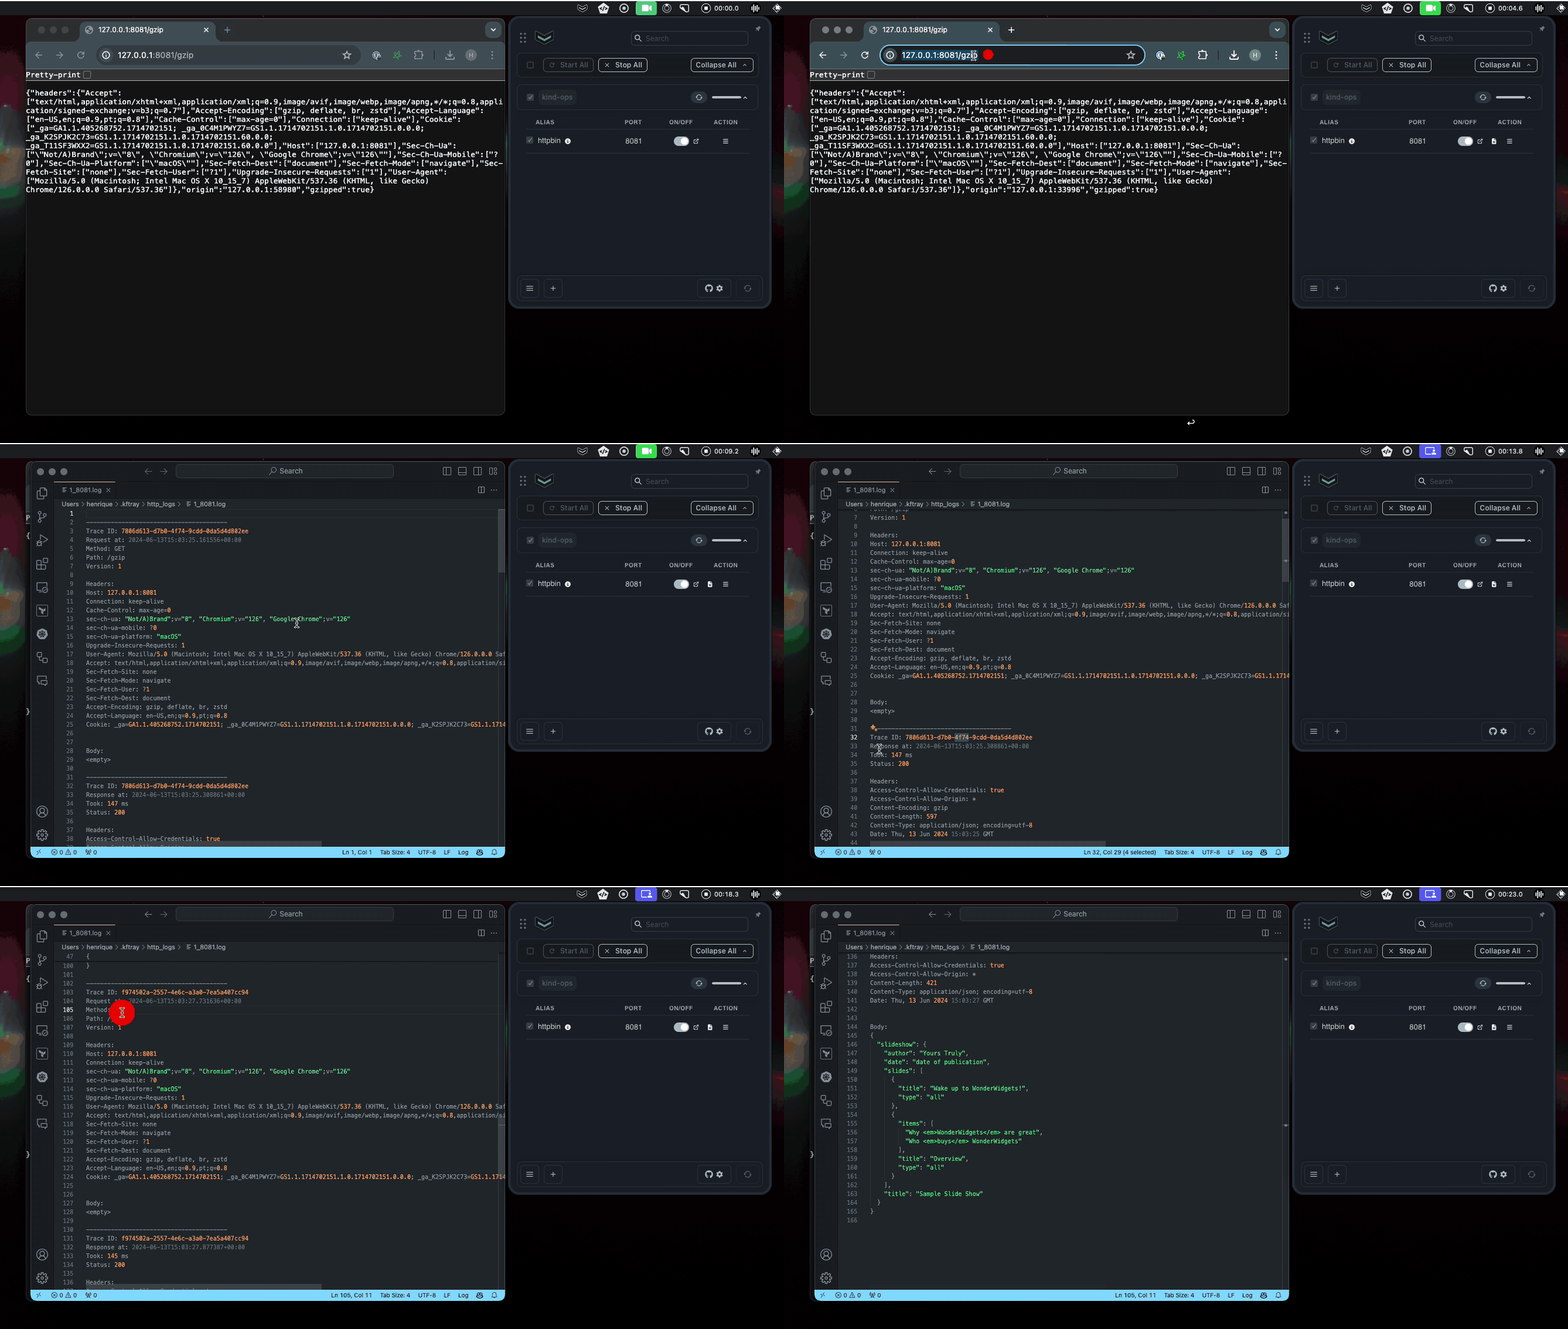
- Trace IDs for Requests and Responses: Each request and response in the log has the same trace ID to help identify linked requests and responses when handling multiple parallel requests.
- Better Connection Reliability: Improvements in the KFtray server and desktop client.
- Smaller Bundle Sizes: More efficient installation.
Using the New Feature - HTTP Traffic Logging
To utilize the new HTTP traffic logging feature, ensure you have the latest version of KFtray installed. Visit the GitHub releases page and download the latest version of KFtray for your operating system. Follow the installation instructions specific to your OS to complete the setup.
Once installed, Ensure the version number displayed in the logo icon tooltip matches the latest release v0.11.7.
Step 1: Open KFtray
Launch KFtray by clicking its icon or typing kftray in the terminal if you installed it using Homebrew..This will open the main interface when you click the system tray icon, where you can manage your configurations.
Step 2: Turn On HTTP Logging
- Open Settings: Click the KFtray icon in your system tray and select the configuration panel from the menu.
- Start Port Forward: Toggle the switch button to enable the configured port forwarding.
- Pick a Configuration: In the same row of the switch button, click the hamburger icon to open the configurations from the forwarded port.
- Enable Logging: Locate the "Enable HTTP Logging" and click it to turn on HTTP logging for that configuration.

Step 3: View HTTP Logs
- Find Logs: HTTP logs are automatically saved in the directory
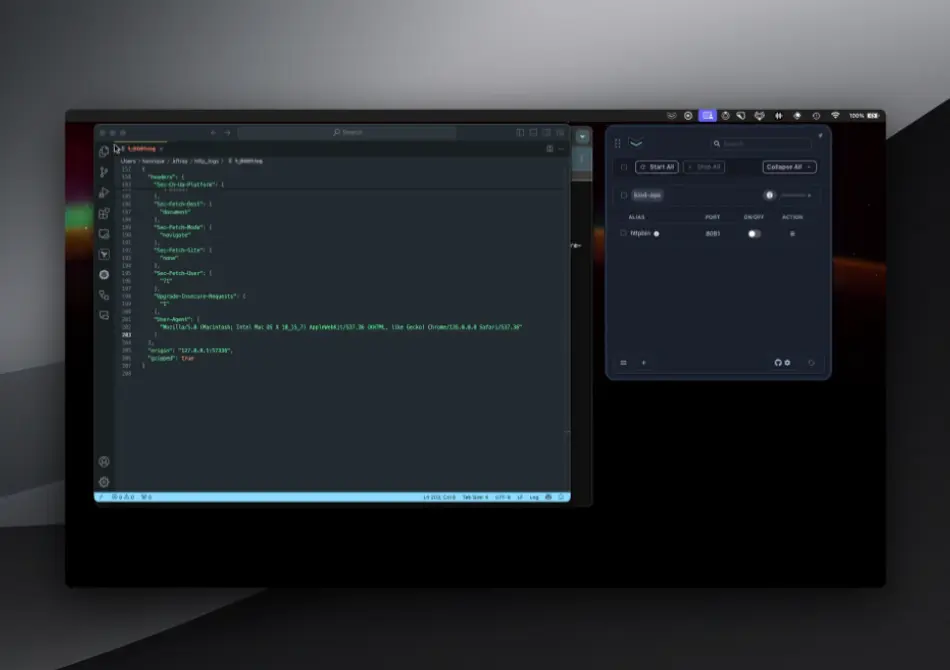
$HOME/.kftray/http_logs/{config_id}_{local_port}. Each log file is named based on the configuration ID and local port for easy identification. - Open Logs: To view the logs, click the log icon button next to your configuration. This will open the log file in your default text editor, allowing you to inspect the HTTP requests and responses.
- Trace IDs: Each request and response in the log has the same trace ID, making it easier to identify linked requests and responses when handling multiple parallel requests.

HTTP Logs Sample
cat $HOME/.kftray/http_sniff/1_8080.log
Step 4: Clean Logs Folder
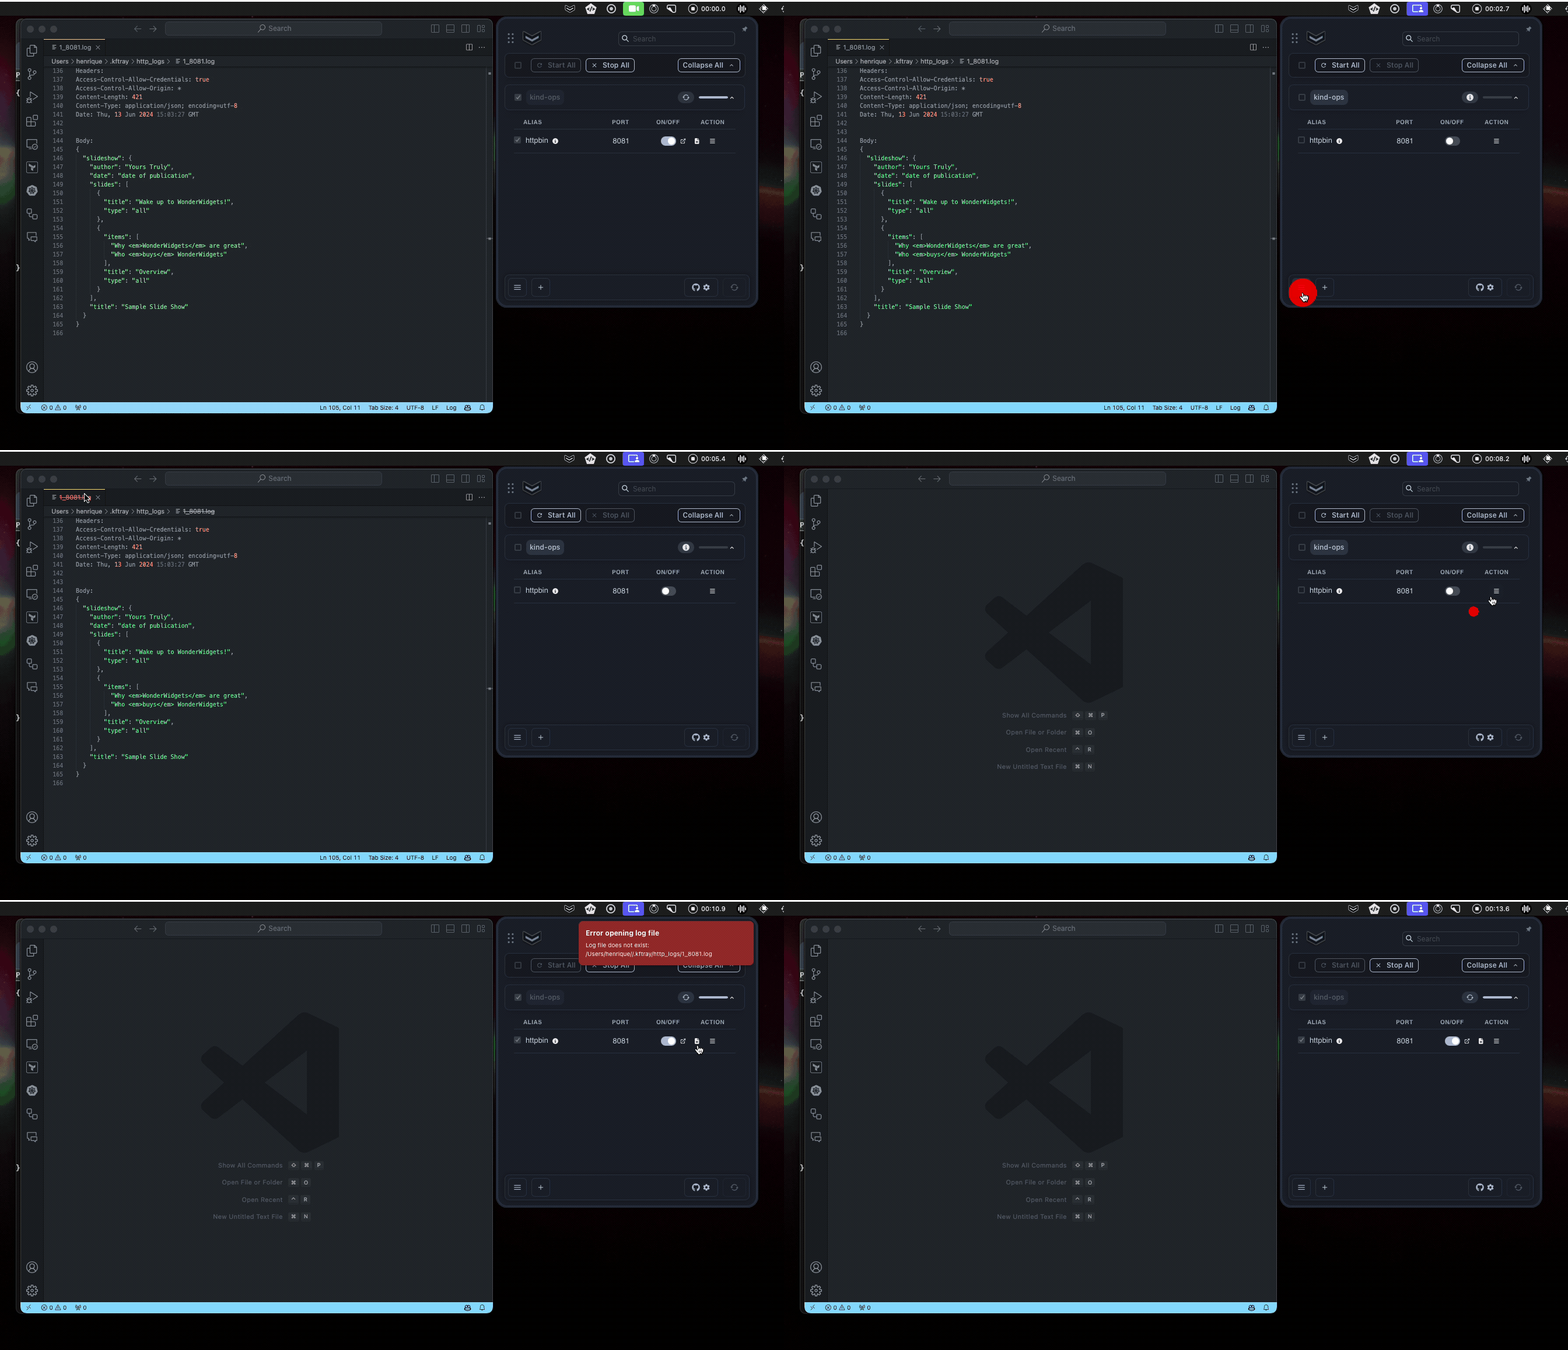
To manage disk space and keep your logs organized, you can clean the logs folder and check the size of the logs folder from kftray.
- Open Main Menu: Click the system tray icon to open the main window, then click the hamburger icon in the bottom-left corner. You should see a button
Prune Logs (0.00 MB)that displays the size of the HTTP logs folder. - Prune Logs: Click the
Prune Logsbutton to remove all the HTTP log files from the logs folder and reclaim disk space.

Real-World Use Cases
Debugging CLI Tools
When using CLI tools that abstract HTTP calls, such as LocalStack, it can be challenging to debug the underlying HTTP requests and responses. HTTP logging in KFtray can help you capture and analyze these interactions.
Example: If you're using a CLI tool like LocalStack to simulate AWS services locally, enable HTTP logging for the configurations that interact with LocalStack. The logs will capture all HTTP requests and responses made by the CLI tool, including trace IDs to link related requests and responses. This makes it easier to debug issues and understand the behavior of the CLI tool.
Save History of HTTP Requests and Don't Lose Made Requests
By enabling HTTP logging, you can save a history of all HTTP requests and responses. This ensures that you don't lose any made requests, which is especially useful for debugging and auditing purposes.
Example: If you need to review past interactions or troubleshoot issues that occurred previously, the saved logs will provide a complete history of HTTP traffic, including trace IDs to link related requests and responses.
Fixing Microservices Issues
When developing a microservice architecture, use HTTP logging to view detailed request and response data. This helps identify issues in interactions between services.
Example: If a service interaction fails intermittently, enable HTTP logging for the configurations involved. Use the logs to pinpoint the problem, such as incorrect request parameters or unexpected response formats. The trace IDs will help you link related requests and responses.
Security Audits
Capture and review HTTP traffic logs to ensure no sensitive data is exposed in requests or responses. This is crucial for maintaining security compliance.
Example: Enable HTTP logging for configurations handling sensitive data. Regularly review the logs to verify that no private information is being leaked. The trace IDs will help you track the flow of sensitive data through your system.
Solving Intermittent Problems
Capture HTTP traffic during the occurrence of intermittent issues to find patterns or anomalies that may be causing the problems.
Example: Users report sporadic issues with your web application. Enable HTTP logging for the related configurations and capture traffic during the problem periods. Analyze the logs to identify any patterns or anomalies. Use the trace IDs to correlate requests and responses during the issue periods.
Boosting Performance
Monitor HTTP logs to identify slow endpoints and optimize the performance of your application.
Example: If certain endpoints are slow, enable HTTP logging for those configurations. Use the logs to identify the bottlenecks and optimize the endpoints for better performance. Trace IDs will help you follow the request-response cycle and pinpoint delays.
Wrap-Up
The new logging of HTTP traffic in KFtray v0.11.7 takes the work out of debugging and simplifies it. Turn logging on for your configurations and you'll be fixing issues in minutes. Trace IDs enable easy request and response correlation even when handling multiple requests in parallel.
Star us on GitHub ⭐
Quick Demo
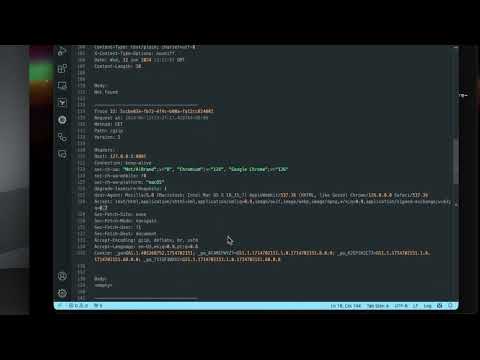
This video demonstrates the complete flow of this new feature.

