

So... the kftray/kftui docs are pretty messy right now, and I figured writing this blog post would be easier than fixing everything properly. I'll organize the docs later, but this should cover what kftui does and how to use it.
kftui has most of the same stuff as kftray, but this guide is just about the terminal version.
First of all - kftray and kftui are independent, cross-platform applications. They help you set up and manage multiple port-forwarding settings easily. Both apps are basically the same tool with different interfaces. kftray is the GUI version with windows and buttons. kftui is the terminal version that runs in your command line. They share the same database and configs. Set up a port-forward in kftray's GUI, and you'll see it in kftui too. Save something in kftui, and it shows up in kftray. You can use whichever one you prefer or switch between them.
Oh, and the whole thing is open source, so you can check out the code on github.com/hcavarsan/kftray if you want to contribute or report bugs, or if you just want to use it, get the downloads from kftray.app/downloads - there's more install options in the next section too
Why Build a Terminal Interface?
I built kftui to address some practical limitations of GUI applications. Terminal interfaces use significantly fewer system resources, which matters in resource-constrained environments. They work well over SSH connections without requiring X11 forwarding or remote desktop setups.
From a development perspective, maintaining one codebase in Rust is simpler than managing separate frontend and backend projects. This approach reduces complexity and keeps the tool focused on core functionality.
If you've worked with multiple kubectl port-forward processes in different terminal windows, you know how quickly it becomes difficult to manage. kftui provides a centralized way to handle these connections. with some additional features...
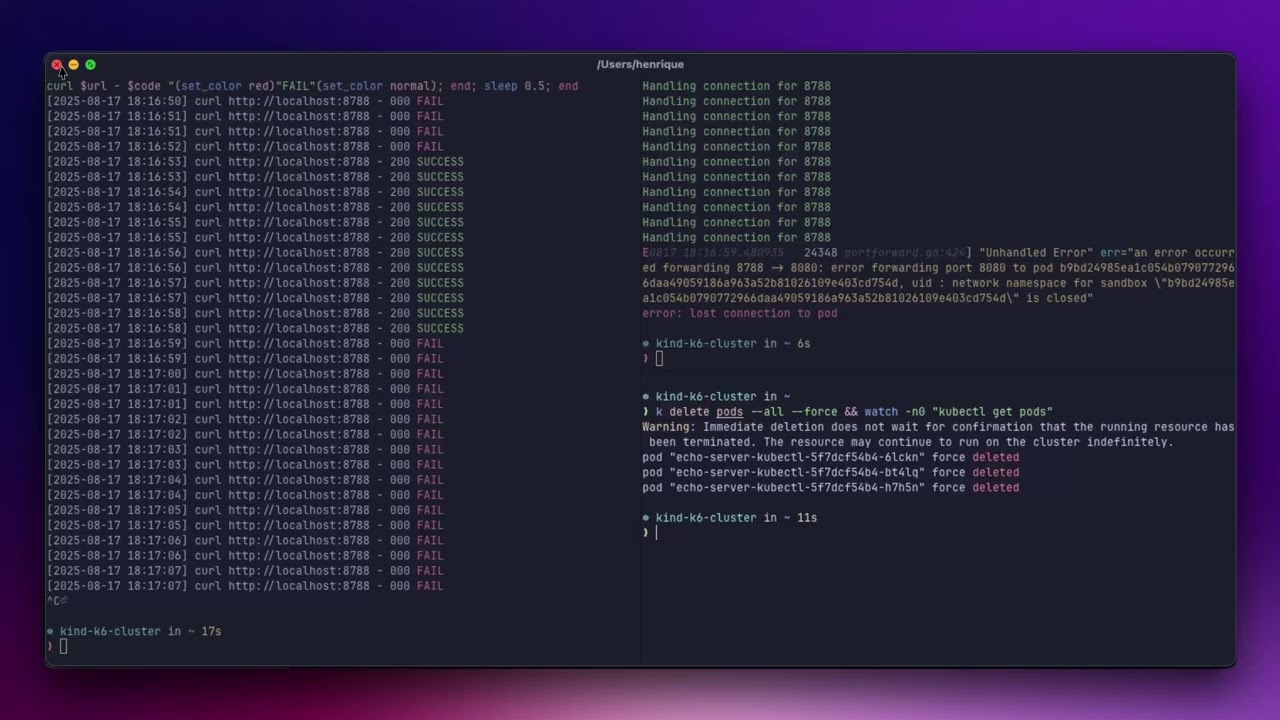
kftray vs kubectl resilience
In this quick demo video, I've tested both tools (kftray and kubectl port-forward) with the same setup - port forwarding to a service while running curl in a loop. Then deleted all pods with kubectl delete pods --all --force to see how each handles recovery.
- kubectl port forward: When pods get deleted, the port forward just dies even though it's forwarding to a service. All requests fail and you have to manually restart it.
- kftray: Loses maybe one request when pods get deleted. The watcher detects changes immediately and reconnects to new pods as they come up. The curl loop keeps going like nothing happened.
Getting Started
You'll need curl or wget installed. Windows users need PowerShell.
Unix-like systems (Linux, macOS, WSL):
Using cargo:
cargo install kftui
Using Homebrew:
brew tap hcavarsan/kftray
brew install kftui
Using curl:
bash <(curl -s https://raw.githubusercontent.com/hcavarsan/kftray/main/hacks/kftui_installer.sh)
Using wget:
bash <(wget -qO- https://raw.githubusercontent.com/hcavarsan/kftray/main/hacks/kftui_installer.sh)
Windows:
Invoke-Expression ((New-Object System.Net.WebClient).DownloadString('https://raw.githubusercontent.com/hcavarsan/kftray/main/hacks/kftui_installer.ps1'))
After installation, restart your terminal and verify it works:
kftui
Basic Usage
Start with a simple configuration file. Create config.json:
[
  {
    "alias": "my-api",
    "context": "minikube",
    "namespace": "default",
    "service": "api-service",
    "local_port": 8080,
    "remote_port": 80,
    "protocol": "tcp",
    "workload_type": "service"
  }
]
Launch kftui with this configuration:
kftui --configs-path config.json
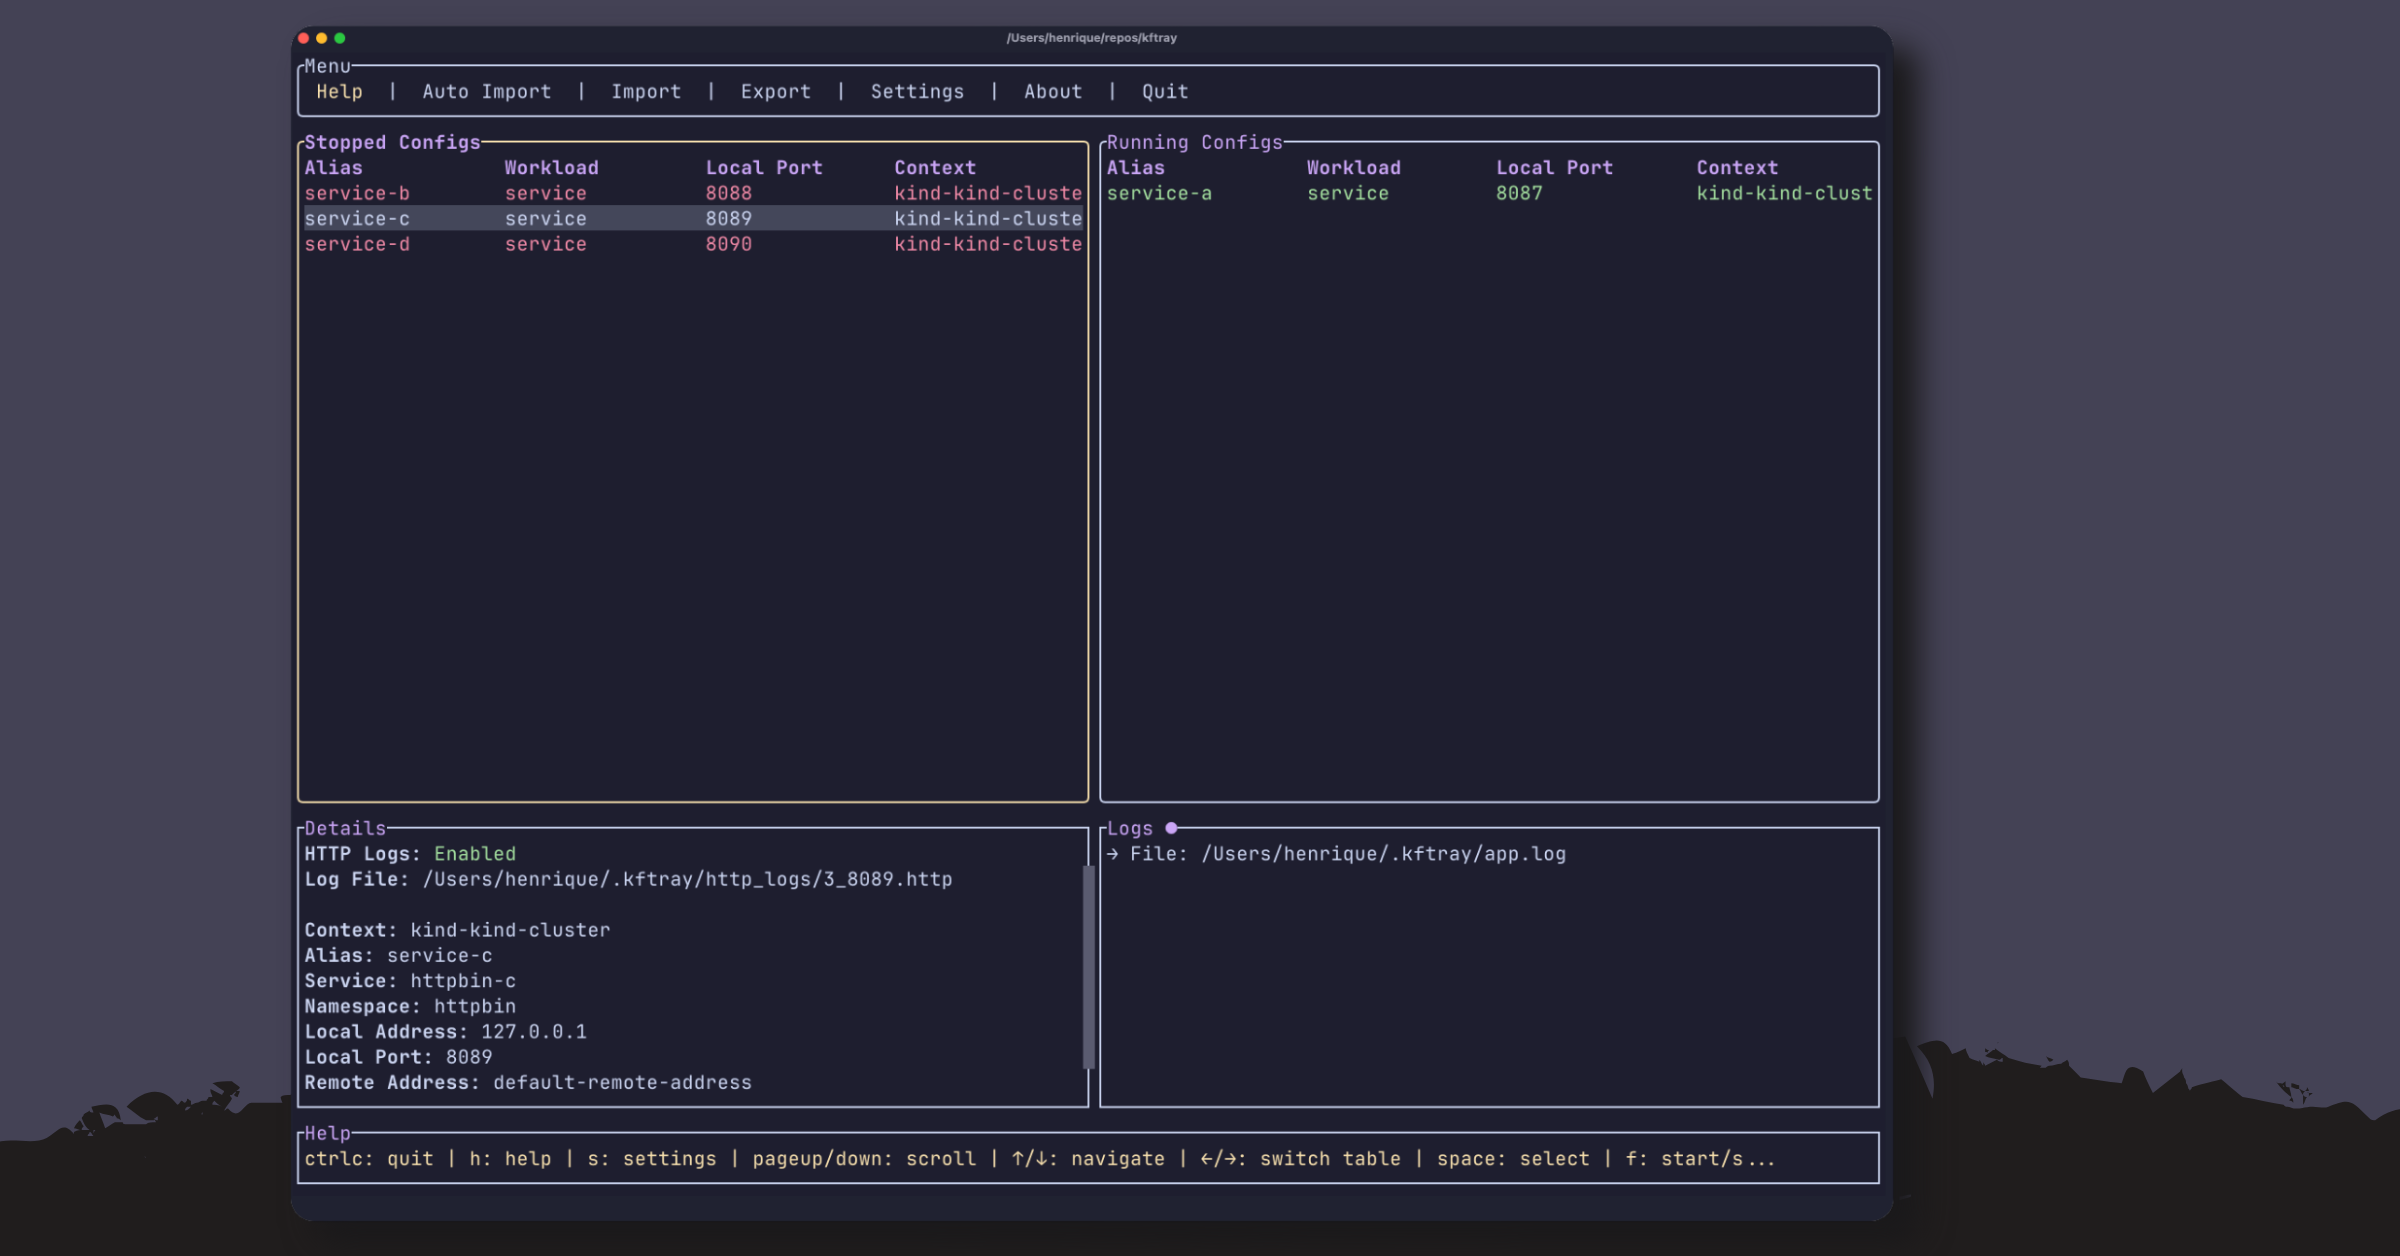
The interface displays your configuration in the "Stopped" table on the left. Press f to start the port-forward. The configuration moves to the "Running" table on the right, and your service becomes accessible at localhost:8080. Press f again to stop it.
Persistent Storage
To avoid specifying the config file path repeatedly, save configurations to kftui's database:
kftui --configs-path config.json --save
After saving, run kftui without arguments to access your stored configurations. This approach works well for frequently used port-forward setups.
Configuration Sources
kftui supports several ways to load configurations, each suited to different workflows.
Local Files
Load configurations from local JSON files:
kftui --configs-path /path/to/config.json
GitHub Repositories
Import configurations from version-controlled repositories:
kftui --github-url https://github.com/your-team/k8s-configs --configs-path environments/dev.json
This method works well for teams that maintain environment-specific configurations in version control.
Inline JSON
Pass JSON configuration directly for scripting scenarios:
kftui --json '[{"alias":"test","namespace":"default","service":"my-service","local_port":8080,"remote_port":80,"protocol":"tcp","workload_type":"service"}]'
Standard Input
Read configurations from stdin for pipeline integration:
echo '[{"alias":"api",...}]' | kftui --stdin
Command-Line Options
--save: Store configurations in the database for future use
--flush: Clear existing configurations before importing new ones
--auto-start: Start all port-forwards immediately after loading
--non-interactive: Run without the interface for automation scripts
Service Auto-Discovery
Rather than manually creating configuration files, kftui can discover services through Kubernetes annotations. This approach keeps port-forward configurations synchronized with service definitions.
Add annotations to your Kubernetes services:
apiVersion: v1
kind: Service
metadata:
  name: monitoring-stack
  namespace: observability
  annotations:
    kftray.app/configs: "grafana-3000-3000,prometheus-9090-9090,alertmanager-9093-9093"
spec:
  selector:
    app: monitoring
  ports:
    - name: grafana
      port: 3000
    - name: prometheus
      port: 9090
    - name: alertmanager
      port: 9093
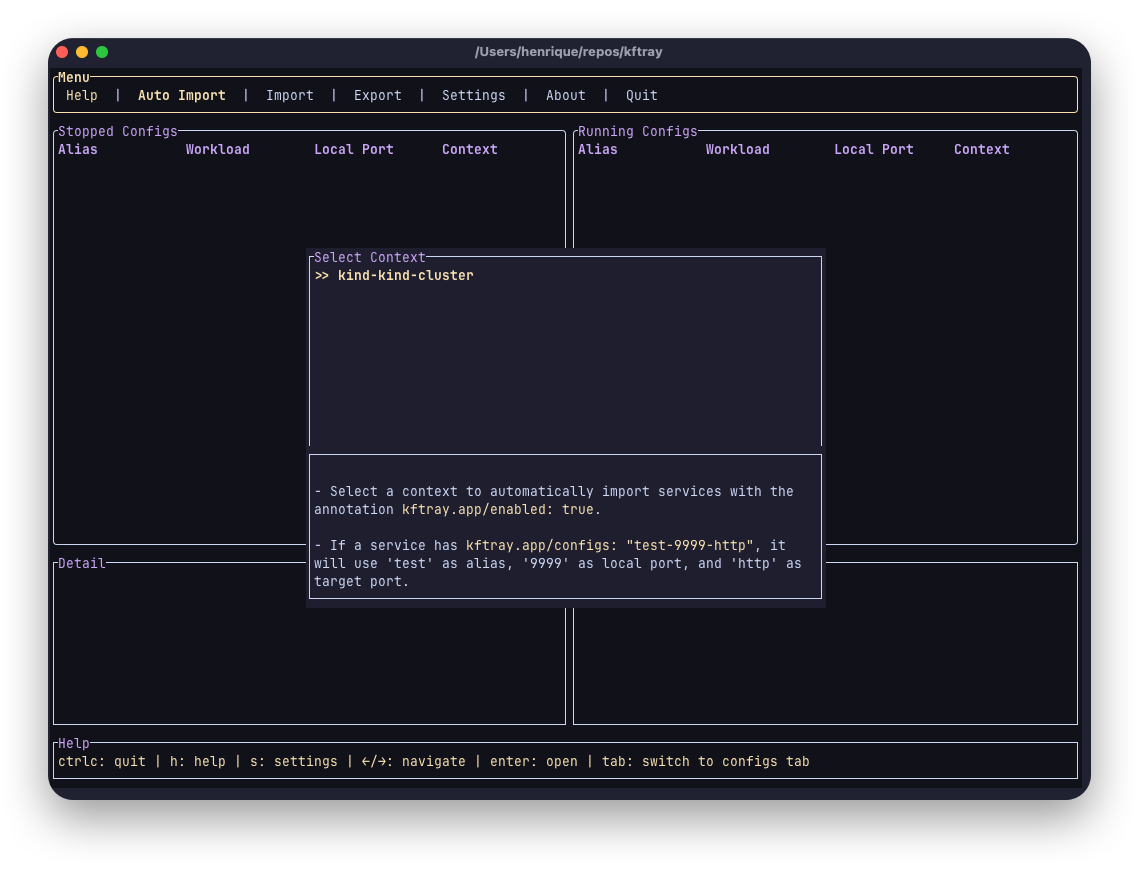
The annotation format is alias-local_port-remote_port. Multiple configurations are separated by commas.
To use auto-discovery, navigate to the top menu in kftui and select "Auto Add". Choose your Kubernetes context from the available options, and kftui will create configurations for all annotated services in that context.
Interface Organization
The interface consists of four main areas:
- Top menu bar: Contains Help, Auto Add, Import, Export, Settings, About, and Exit options
- Stopped configurations (left): Displays configurations ready to start
- Running configurations (right): Shows active port-forwards with status information
- Details panel (bottom): Provides information about the selected configuration
Menu Navigation
The top menu provides seven functions:
- Help: Display usage information and keyboard shortcuts
- Auto Add: Discover services from your Kubernetes cluster
- Import: Load configuration files through a file browser
- Export: Save current configurations to a JSON file
- Settings: Configure application behavior
- About: Show version and project information
- Exit: Stop all active port-forwards and close the application
Navigate menu items with ←/→ arrow keys and press Enter to select.
Application Settings
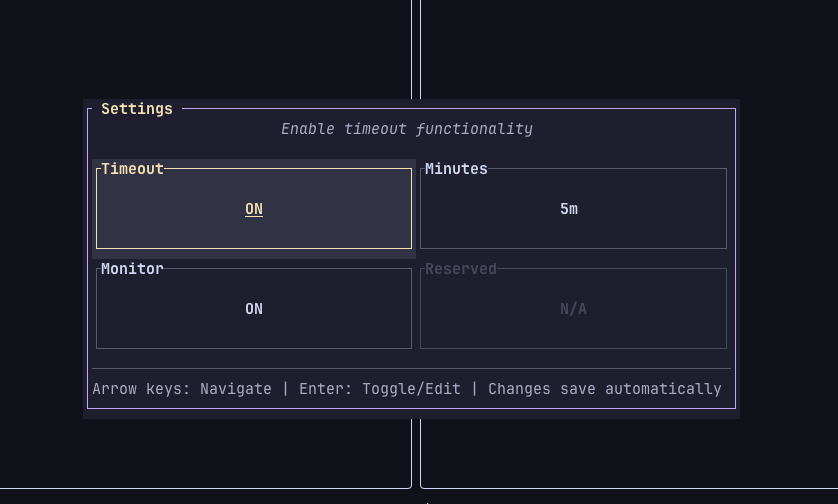
Access settings by pressing s or selecting Settings from the menu.
- Disconnect Timeout: Configure automatic disconnection after a specified period of inactivity. Set to 0 to disable automatic timeouts.
- Network Monitor: Enable or disable network connectivity monitoring. When enabled, kftui monitors network status and attempts to reconnect dropped port-forwards.
Settings persist between application sessions.
HTTP Request Logging
kftui provides HTTP request and response logging for debugging network traffic through port-forwards.
Enable logging by setting "http_logs_enabled": true in your configuration file, or toggle it for existing configurations by pressing l in the interface.
HTTP Logs Viewer
Press Shift+V to open the HTTP logs viewer, which operates in two modes:
HTTP List Mode (default view):
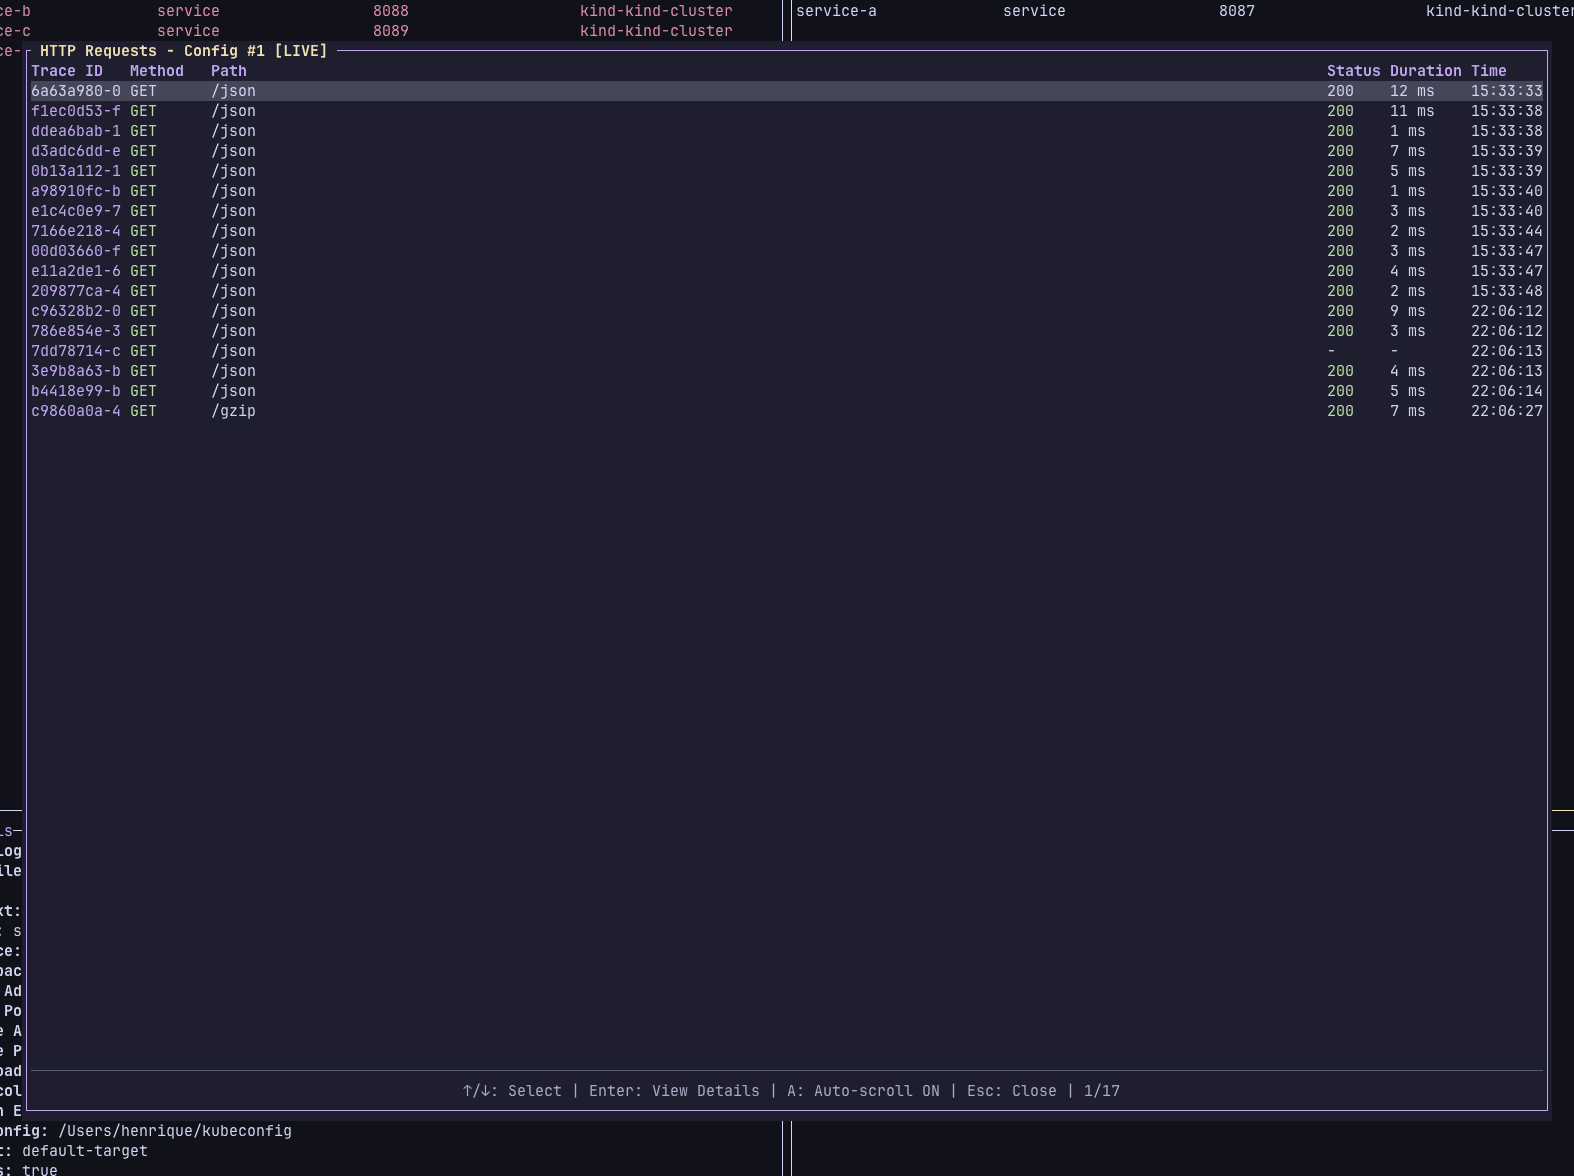
- Displays all HTTP requests with timestamps and status codes
- Navigate requests with
↑/↓arrow keys - Use
PageUp/PageDownto scroll through multiple entries - Press
Enteron any request to view detailed information - Press
ato toggle automatic scrolling for new requests
HTTP Detail Mode :
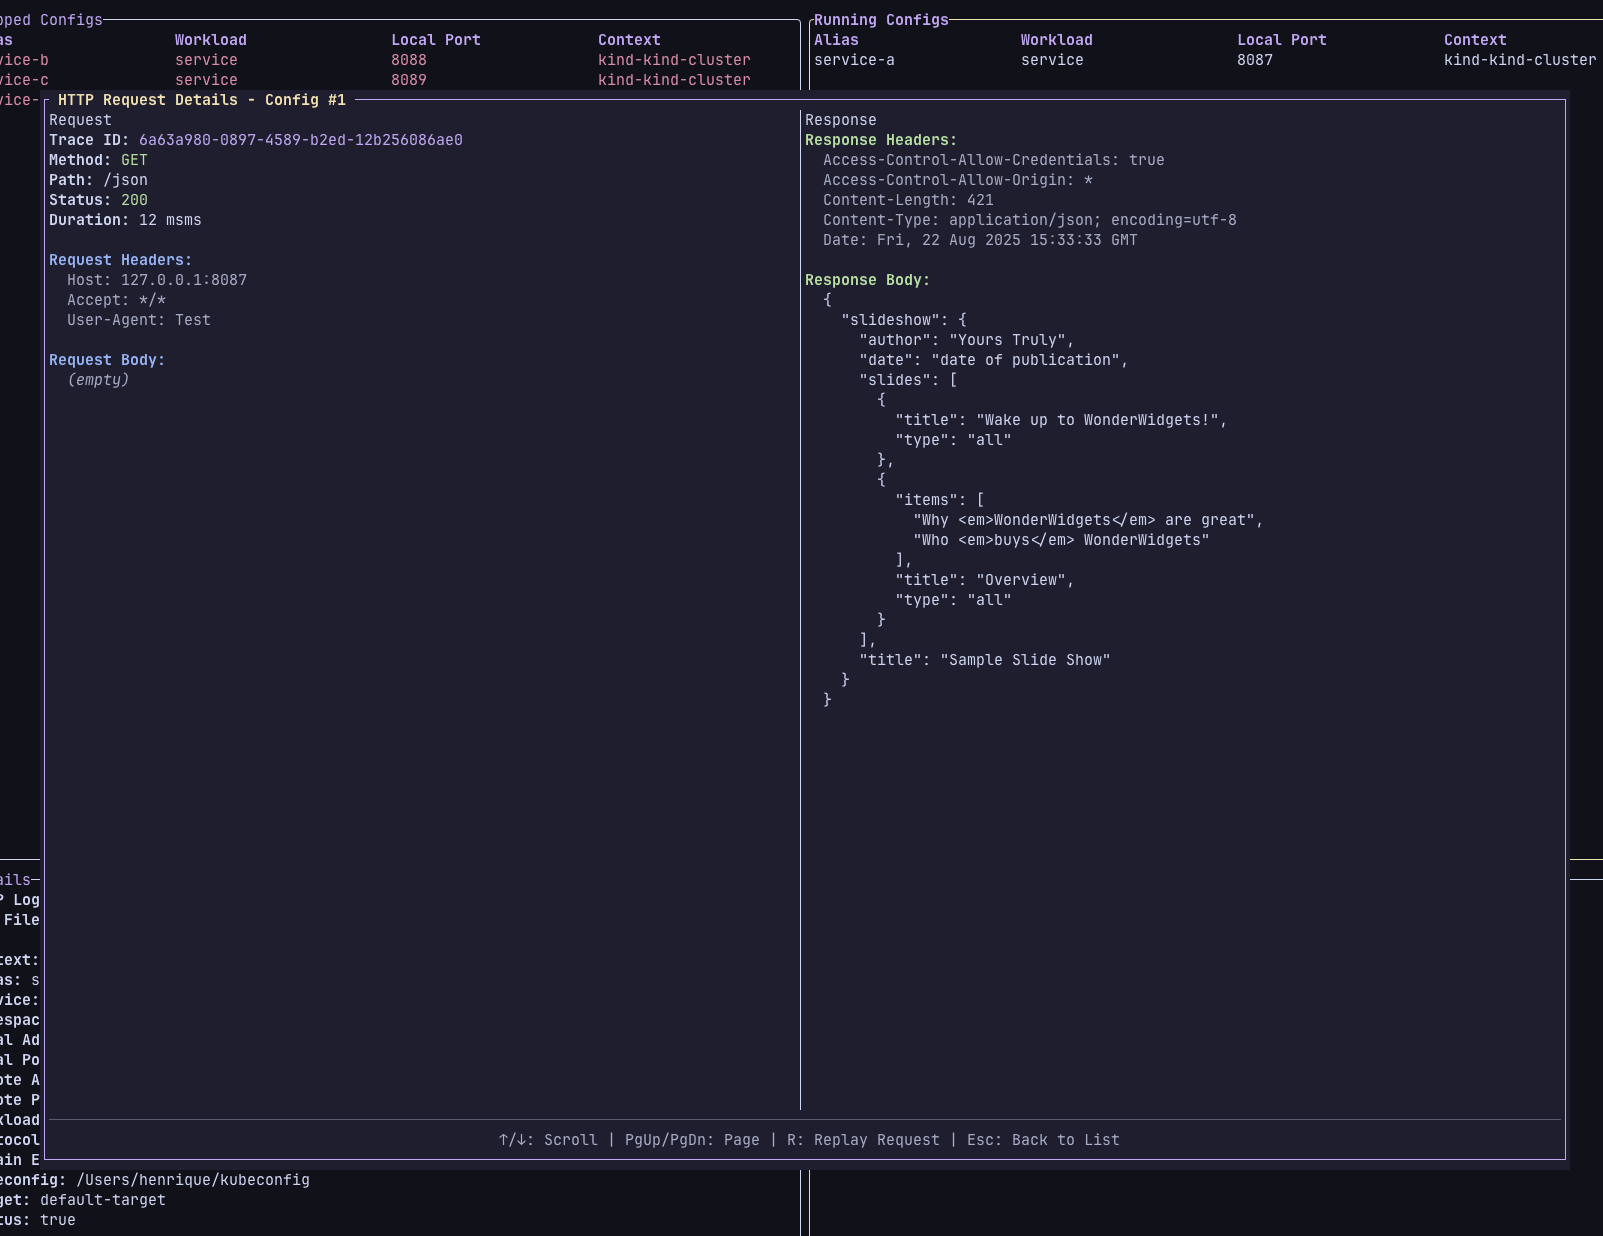
- Shows complete request and response information including headers and body content
- Scroll through details with
↑/↓arrow keys - Use
PageUp/PageDownfor faster navigation - Press
rto replay the selected request - Press
Escto return to list mode
HTTP Logs Configuration
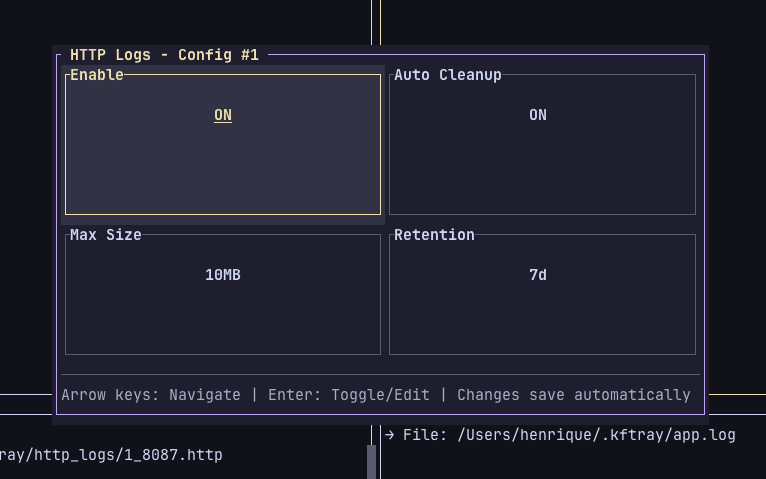
Press L to configure HTTP logging behavior:
- Enable or disable logging for individual configurations
- Set maximum log file size (1-1000 MB)
- Configure retention period (1-365 days)
- Enable automatic cleanup of old log files
Complete Keyboard Reference
| Key | Function |
|---|---|
f | Start or stop port-forward |
i | Import configurations |
e | Export configurations |
d | Delete selected configurations |
a | Select all configurations |
Space | Toggle individual selection |
Tab | Switch between interface components |
←/→ | Navigate menu items |
s | Open settings |
h | Show help information |
q | Show about information |
l | Toggle HTTP logging |
L | Configure HTTP logging |
V | View HTTP logs |
o | Open HTTP logs in external editor |
↑/↓ | Navigate within sections |
PageUp/PageDown | Scroll through content |
Home/End | Jump to first/last item |
Ctrl+C | Exit application |
Configuration File Structure
Configuration files use JSON format with the following fields:
{
  "alias": "my-service",           // Display name in interface
  "namespace": "production",       // Kubernetes namespace (required)
  "service": "api-service",        // Target service name
  "local_port": 8080,             // Local binding port
  "remote_port": 80,              // Remote service port
  "protocol": "tcp",              // Network protocol (required)
  "workload_type": "service",     // Target type: "service" or "pod"
  "context": "prod-cluster",      // Kubernetes context
  "kubeconfig": "/path/to/config", // Kubeconfig file path
  "http_logs_enabled": true       // Enable HTTP logging
}
The minimum required fields are namespace and protocol. When ports are not specified, kftui attempts to determine appropriate values from the service definition.
How kftui Relates to kftray
What kftui Can Do
kftui handles pretty much everything the kftray GUI does, just through terminal commands and keyboard shortcuts. The auto-discovery stuff saves time by reading your Kubernetes service annotations instead of making you type configs manually. The HTTP logging is useful for debugging API calls and seeing what requests are going through your port-forwards.
If you work mostly in terminals or need to manage port-forwards over SSH, kftui covers everything without needing a desktop environment.
Demo Video HTTP Logs
Video demonstration on how to inspect HTTP traffic through requests in port forwarding.

Additional Resources
For more information:
If you find kftray or kftui useful, consider starring the project on GitHub ⭐